New Health Management Service: Visualizing Health from Sleep
New Health Management Service: Visualizing Health from Sleep


Sleep Deviation Score Ranking
by Prefecture
Here is the sleep deviation score ranking of 47 prefectures, based on the survey results of approximately 10,000 people nationwide.
Aomori Prefecture, ranked first, showed that many residents rarely felt sleepy during the day due to good sleep quality and habits. It also ranked third nationwide in terms of sleep duration.
On the other hand, Miyagi Prefecture, which ranked last, did not notably stand out in terms of short sleep duration, but showed a negative trend in sleep habits, health status, and stress levels. It also had the highest number of people at risk of sleep apnea syndrome, one of the sleep disorders.
Ranking Results
TOP 3
- 1st
-
Aomori Prefecture
Total Score Deviation 52.21
Sleep Duration 6h 40min
- 2nd
-
Shizuoka Prefecture
Total Score Deviation 51.63
Sleep Duration 6h 36min
- 3rd
-
Wakayama Prefecture
Total Score Deviation 51.30
Sleep Duration 6h 31min
WORST 3
- 47th
-
Miyagi Prefecture
Total Score Deviation 47.92
Sleep Duration 6h 32min
- 46th
-
Tokushima Prefecture
Total Score Deviation 48.31
Sleep Duration 6h 15min
- 45th
-
Yamanashi Prefecture
Total Score Deviation 48.35
Sleep Duration 6h 25min
-
- 4th
- Oita Prefecture
Total Score Deviation 51.22
Sleep Duration 6h 33min -
- 5th
- Nara Prefecture
Total Score Deviation 51.18
Sleep Duration 6h 27min -
- 6th
- Hiroshima Prefecture
Total Score Deviation 50.94
Sleep Duration 6h 31min -
- 7th
- Chiba Prefecture
Total Score Deviation 50.69
Sleep Duration 6h 26min -
- 8th
- Hokkaido
Total Score Deviation 50.63
Sleep Duration 6h 35min -
- 9th
- Kumamoto Prefecture
Total Score Deviation 50.59
Sleep Duration 6h 28min -
- 10th
- Kochi Prefecture
Total Score Deviation 50.52
Sleep Duration 6h 47min -
- 11th
- Kagawa Prefecture
Total Score Deviation 50.50
Sleep Duration 6h 33min -
- 12th
- Okayama Prefecture
Total Score Deviation 50.41
Sleep Duration 6h 27min -
- 13th
- Fukuoka Prefecture
Total Score Deviation 50.33
Sleep Duration 6h 37min -
- 14th
- Tochigi Prefecture
Total score standard deviation 50.28
Sleep duration 6h 26m -
- 15th
- Niigata Prefecture
Total score standard deviation 50.22
Sleep duration 6h 33m -
- 16th
- Toyama Prefecture
Total score standard deviation 50.20
Sleep duration 6h 25m -
- 17th
- Aichi Prefecture
Total score standard deviation 50.18
Sleep duration 6h 26m -
- 18th
- Gifu Prefecture
Total score standard deviation 50.16
Sleep duration 6h 33m -
- 19th
- Tottori Prefecture
Total score standard deviation 50.09
Sleep duration 6h 39m -
- 20th
- Mie Prefecture
Total score standard deviation 50.03
Sleep duration 6h 35m -
- 21st
- Miyazaki Prefecture
Total score standard deviation 50.02
Sleep duration 6h 27m -
- 22nd
- Saitama Prefecture
Total score standard deviation 50.01
Sleep duration 6h 22m -
- 23rd
- Tokyo Metropolis
Total score standard deviation 49.98
Sleep duration 6h 21m -
- 24th
- Hyogo Prefecture
Total score standard deviation 49.95
Sleep duration 6h 26m -
- 25th
- Fukui Prefecture
Total score standard deviation 49.93
Sleep duration 6h 34m -
- 26th
- Shimane Prefecture
Total score standard deviation 49.90
Sleep duration 6h 31m -
- 27th
- Kanagawa Prefecture
Total score standard deviation 49.87
Sleep duration 6h 20m -
- 28th
- Akita Prefecture
Total score standard deviation 49.78
Sleep duration 6h 34m -
- 29th
- Nagasaki Prefecture
Total score standard deviation 49.75
Sleep duration 6h 32m -
- 30th
- Ibaraki Prefecture
Total score standard deviation 49.65
Sleep duration 6h 21m -
- 31st
- Kagoshima Prefecture
Total score standard deviation 49.63
Sleep duration 6h 30m -
- 32nd
- Ishikawa Prefecture
Total score standard deviation 49.60
Sleep duration 6h 34m -
- 33rd
- Iwate Prefecture
Total score standard deviation 49.59
Sleep duration 6h 42m -
- 34th
- Gunma Prefecture
Total score standard deviation 49.55
Sleep duration 6h 22m -
- 35th
- Yamaguchi Prefecture
Total score standard deviation 49.54
Sleep duration 6h 32m -
- 36th
- Kyoto Prefecture
Total score standard deviation 49.50
Sleep duration 6h 19m -
- 37th
- Okinawa Prefecture
Total score standard deviation 49.34
Sleep duration 6h 32m -
- 38th
- Yamagata Prefecture
Total score standard deviation 49.31
Sleep duration 6h 28m -
- 39th
- Nagano Prefecture
Total score standard deviation 49.27
Sleep duration 6h 33m -
- 40th
- Ehime Prefecture
Total score standard deviation 49.25
Sleep duration 6h 26m -
- 41st
- Osaka Prefecture
Total score standard deviation 49.22
Sleep duration 6h 24m -
- 42nd
- Shiga Prefecture
Total score standard deviation 49.12
Sleep duration 6h 22m -
- 43rd
- Saga Prefecture
Total score standard deviation 49.02
Sleep duration 6h 24m -
- 44th
- Fukushima Prefecture
Total Score Deviation 48.75
Sleep Duration 6h 34m
Average Sleep Duration in Japan
"Japan's sleep debt is reaching a breaking point"
In recent years, chronic sleep deprivation has accumulated like debt, and people are finding it difficult to repay it. This "sleep debt" is noticeable not only among business professionals but also among homemakers and children, necessitating prompt countermeasures.
It has become clear that sleep is not just for rest or relieving drowsiness; it plays crucial roles such as regulating the autonomic nervous system and hormone balance, consolidating memories, enhancing immune function, and removing waste products from the brain. Insufficient sleep increases the risk of lifestyle diseases like obesity, diabetes, and high blood pressure, as well as mental illnesses, infections, cancer, and dementia.
While it's difficult to significantly increase sleep duration while working, even an extra 15 minutes of sleep daily can be effective. Let's improve Japan's broken sleep habits.
Survey Results
Sleep duration 55 minutes shorter
than WORST 1
Average Sleep Duration in Japan

Relationship between SAS Risk and
BMI
"22% of people have a high risk of
Sleep Apnea Syndrome (SAS)"
Sleep Apnea Syndrome, requiring medical treatment, is a common sleep disorder. As its name suggests, it is a condition where "apnea" (cessation of breathing) repeatedly occurs during "sleep," disrupting sleep. It is also referred to as "SAS," an acronym for Sleep Apnea
Syndrome. In this disorder, "apnea" is counted as a single episode of breathing cessation lasting 10 seconds or more, and the frequency of breathing cessation per hour is used as an indicator. Suffering from moderate to severe SAS (15 or more episodes of breathing cessation per hour) increases the risk of myocardial infarction and cerebral infarction by 2 to 4 times compared to normal, and there is also a terrifying statistic that approximately 40% of those who leave it untreated die within about 8 years.
Factors contributing to SAS include fat deposition around the soft tissues of the upper airway, such as the neck and throat, due to weight gain, enlarged tonsils, and narrowing of the throat and upper airway due to the tongue base (root of the tongue) and uvula.
For this reason, it is often perceived as a disease that affects obese men, but Asians tend to have narrower airways due to their small, recessed jaw shape, so it is important to remember that even thin people, women, and children can be affected.
This survey revealed that 22% of the total Japanese population has a high risk of Sleep Apnea Syndrome.
Survey Results
Distribution of BMI, sleep deviation value, and
sleep duration for those with high SAS risk

Overall distribution, sleep deviation value, and sleep duration

This survey confirmed once again that a higher BMI is associated with a higher SAS risk.
98% of those with high SAS risk reported being told they snore. Additionally, 68% of individuals with high SAS risk stated they had gained more than 10kg since turning 20.
Sleep Deviation by Occupation
"Young executives' sleep is in danger"
Depending on their profession, some people work night shifts or reverse day-night schedules, making it difficult to get quality sleep and battling sleep debt.
Many may think that some sleep deprivation is unavoidable due to being busy every day, but sleep debt should not be underestimated.
Without even realizing it, one might fall into momentary sleep even during work hours. If consciousness fades during work, it could lead to unexpected accidents.
To alleviate sleep debt, it's crucial to creatively arrange shifts and incorporate daytime naps.
Survey Results
Sleep Deviation by Occupation

Awareness of Naps
"67% of Japanese
feel sleepy during the day"
Difficulty sleeping soundly, poor morning wakefulness, overwhelming sleepiness during the day... These concerns can sometimes hide underlying medical conditions.
A representative sleep-related illness is Sleep Apnea Syndrome (SAS). If you suspect you might have SAS, even slightly, we recommend you visit a nearby sleep clinic for a check-up.
Even for those without a sleep disorder, taking a nap can be effective if you feel drowsy during the day. A nap of about 20 minutes before 3 p.m. tends to be effective in alleviating daytime sleepiness without affecting the quality of night sleep. There are also reports that people who take naps of less than 30 minutes have about one-sixth the incidence of dementia compared to those without a napping habit.
Survey Results
Age Distribution of People Desiring Naps

Nap Preference and Sleep Deviation Score

It was found that a high proportion of people across all age groups felt drowsy during the day and desired a nap, with a total of 67% across all age groups. It was also found that the sleep deviation score for those who desired a nap was below average.
TOP/WORST Sleep Deviation
Lifestyles
Among approximately 10,000 people nationwide, there were distinct lifestyle characteristics observed in the TOP 1,000 with good sleep deviation scores and the WORST 1,000 with poor scores.
Sleep and Meals

Significant differences were observed in eating habits. While 79% of the TOP 1000 ate breakfast daily, 7 days a week, only 52% of the WORST 1000 did so.
Regarding late-night snacks, 83% of the TOP 1000 said they did not eat them, whereas only 39% of the WORST 1000 did not, meaning 61% of them ate late-night snacks, with 13% eating them daily, 7 days a week.
Frequency of Eating Breakfast and Late-Night Snacks
(Q: How many days a week do you do this?)
Breakfast
-
Japanese Overall

-
TOP 1000

-
WORST 1000

Late-Night Snacks
-
Japanese Overall

-
TOP 1000

-
WORST 1000

Eating breakfast raises body temperature, sets the daily rhythm, and supplies energy for activities, while also having a circadian rhythm resetting effect. Chewing thoroughly stimulates the brain, making it easier to distinguish between wakefulness and sleep.
Eating late at night activates the stomach, leading to a decrease in sleep quality.
Sleep and Alcohol

42% of the TOP 1000 never drank alcohol, and only 28% drank 3 or more days a week. As for quantity, only 19% drank 2 go (approximately 360ml) or more. In contrast, among the WORST 1000, only 29% did not drink alcohol, and 42% drank alcohol 3 or more days a week. Regarding the quantity of alcohol consumed, 44% drank 2 go or more, and 6% even drank 5 go (approximately 900ml) or more.
Drinking Frequency and Quantity
(Q: How many days a week and how much
alcohol do you drink?)
Frequency
-
Japanese Overall
-
TOP 1000

-
Worst 1000

Amount
-
All Japanese people

-
Top 1000

-
Worst 1000

Excessive alcohol consumption can lead to shallow sleep and has a diuretic effect, which can cause you to wake up in the middle of the night and reduce sleep quality. On the other hand, alcohol can relax an excited brain. It is best to avoid drinking weak alcohol for long periods. If you drink one go of sake, do so 100 minutes before bed. If you drink strong alcohol, a small sip just before bed is acceptable. Learning how to properly manage your alcohol intake is also an important point.
Sleep and Smoking

Significant differences were also observed regarding smoking status. 92% of the Top 1000 currently do not smoke.
In contrast, 43% of the Worst 1000 were smokers, with 29% of them smoking 10 or more cigarettes a day.
Smoking Volume
(Q: How many cigarettes do you smoke per day?)
-
All Japanese people

-
Top 1000

-
Worst 1000

Nicotine, the main component of tobacco, has an awakening effect and can reduce sleep quality.
Quitting smoking normalizes the function of neurotransmitters called acetylcholine, which can lead to higher quality sleep.
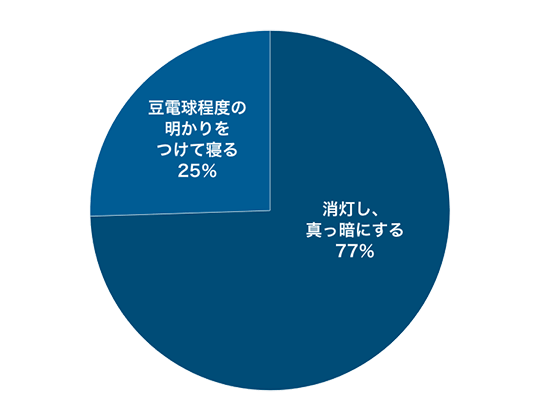
Sleep and Environment

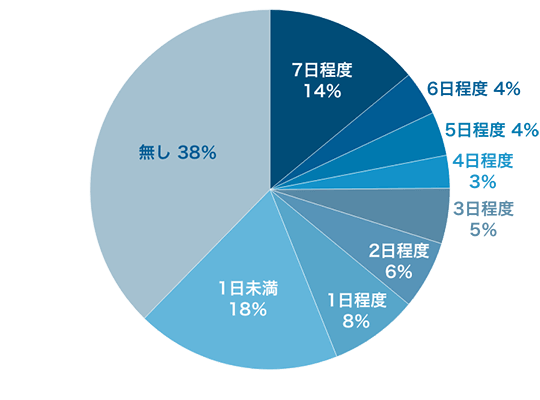
Although not as significant as other categories, 77% of the Top 1000 sleep in a completely dark environment, while only 60% of the Worst 1000 do.
Environment
(Q: How often do you sleep in a quiet, dark room?)
-
All Japanese people

-
Top 1000

-
Worst 1000

Environment
(Q: What is the brightness of the room when you go to bed?)
-
All Japanese people

-
Top 1000
-
Worst 1000

Light is said to be the key to deep sleep. Melatonin, a hormone that promotes sleep, has the characteristic of having its secretion instantaneously inhibited by strong light. Since humans only perceive light with their eyes, it is necessary to consciously limit visual information before going to sleep.
For bedrooms, reddish, warm-colored lights that are closer to sunlight are more suitable than bluish-white fluorescent or LED lights. Also, indirect lighting that illuminates the floor can reduce visual information when going to bed. Furthermore, the bright lighting in convenience stores provides a very strong light stimulus, so it is not advisable to visit one before going to bed at night.
Survey Overview
Survey period: December 2019 / Survey method: Web survey / Target region: Nationwide / Target subjects: Men and women / Sample size: n=10,343s
*For numerical comparisons in percentages, a χ2 (chi-squared) test was conducted to determine the frequency of occurrence, and for comparisons of sleep deviation values between groups, a t-test was conducted. A significance level of 5% or less was determined to be a statistically significant difference and noted.
With the vision of "Sleep Revolution to Overcome Sleep Debt" and aiming to help people lead "the happiest lives" by achieving "the best sleep," we have been active in this field. Despite sleep playing a crucial role in various diseases, there was no way to visualize sleep quality. Therefore, we developed a deviation score standard through our unique research method to visualize sleep in Japan. With this, we aim to contribute to individual sleep improvement and health management, and ultimately to the performance enhancement of employees in companies. We will continue to move forward with the hope that all Japanese citizens can live "the happiest lives with the best sleep."